At MidAmerica Airport, we use the WISERTrade database regularly, at all hours of the day, and from global ports near and far. The trade data that WISERTrade provides is a very versatile tool. The data provides detail for our recommendations to our clients and prospective clients. And we show attribution to WISERTrade so that the data lends full credibility to the presentations we create. The historical data, shows an accurate picture of trends in the export/import side of any industry. And because we can dive deep into the data and view products with up to 10 digits of detail in an HS code, we can view specific products that are shipping down to specific ports of import/export. We look forward to the continued enhancements by WISERTrade.
— Larry Taylor, Business Development, MidAmerica St.Louis Airport
Many thanks for your assistance - we are using the database on nearly a daily basis and have found it incredibly useful.
— Helen Patterson, Policy Advisor at the New Zealand Embassy, Washington, DC
WISERTrade is a great tool for the classroom and sponsored research.
The service and support provided by Jack and his team is excellent.
I highly recommend WISERTrade for universities involved with trade research
and international business education.
— Chad R. Miller, Ph.D.
Assistant Professor & Graduate Coordinator
of the Masters of Science in Economic Development Program,
The University of Southern Mississippi
I have been working with Jack and Carla for the best part of 10 years, they are the best. As a Musical Instrument Manufacturer it is a must to understand the import & export ramifications of your competitors at State, Provincial and Country levels. Wiser is a must have tool for any Domestic or International goods buyer or seller.
Know Your Business
Wiser You Rock
— Nort Hargrove, VP Manufacturing, Sabian Cymbal Manufacturers
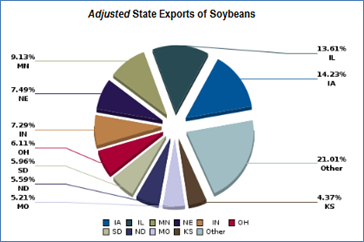
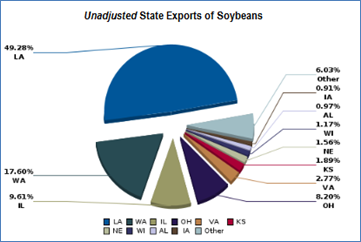 Such non-processed and minimally processed agricultural commodities are perhaps most significantly illustrated by soybeans. Corrected data shows Louisiana and Washington likely to be the origin of only 1.37% of exported soybeans (calculating this from data derived from USDA estimates of cash receipts on farms) while 67.08% of soybean exports are attributed to these same two States by traditional trade reports.
 Please contact