
WISERTrade Products
Data Reports
Data Reports
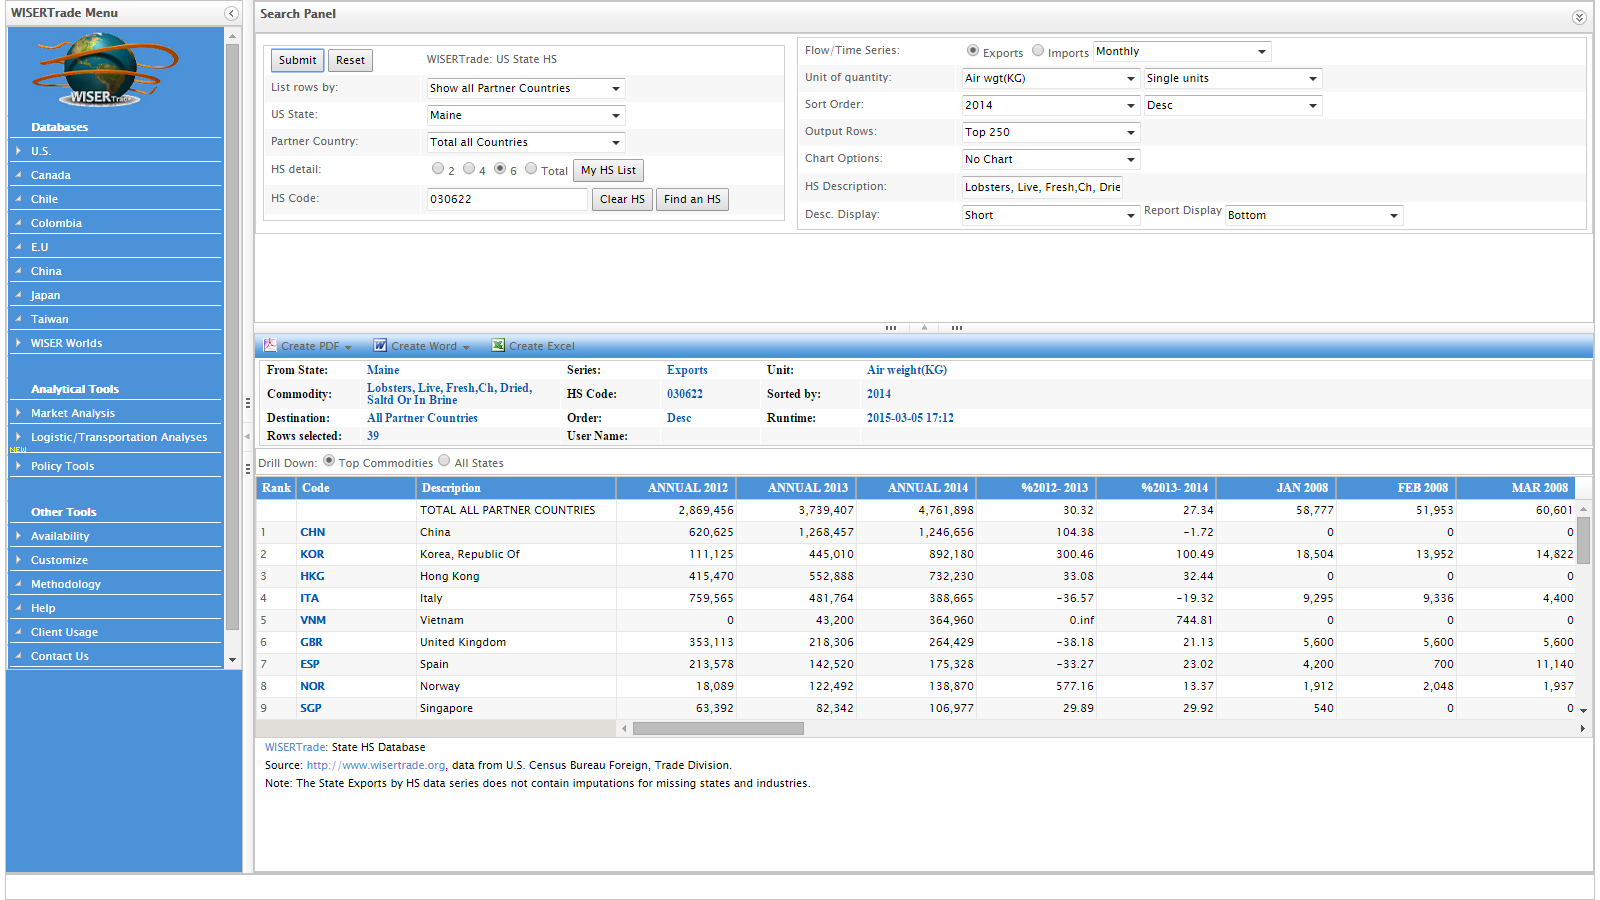
WISERTrade provides detailed, monthly trade statistics for 35 countries--the U.S., Canada, the 28 EU Countries, China, Japan, Taiwan, Chile and Colombia-and annual data for 130 additional countries. The WISERTrade interface is user friendly and fast, with the search form and result table on a single page.
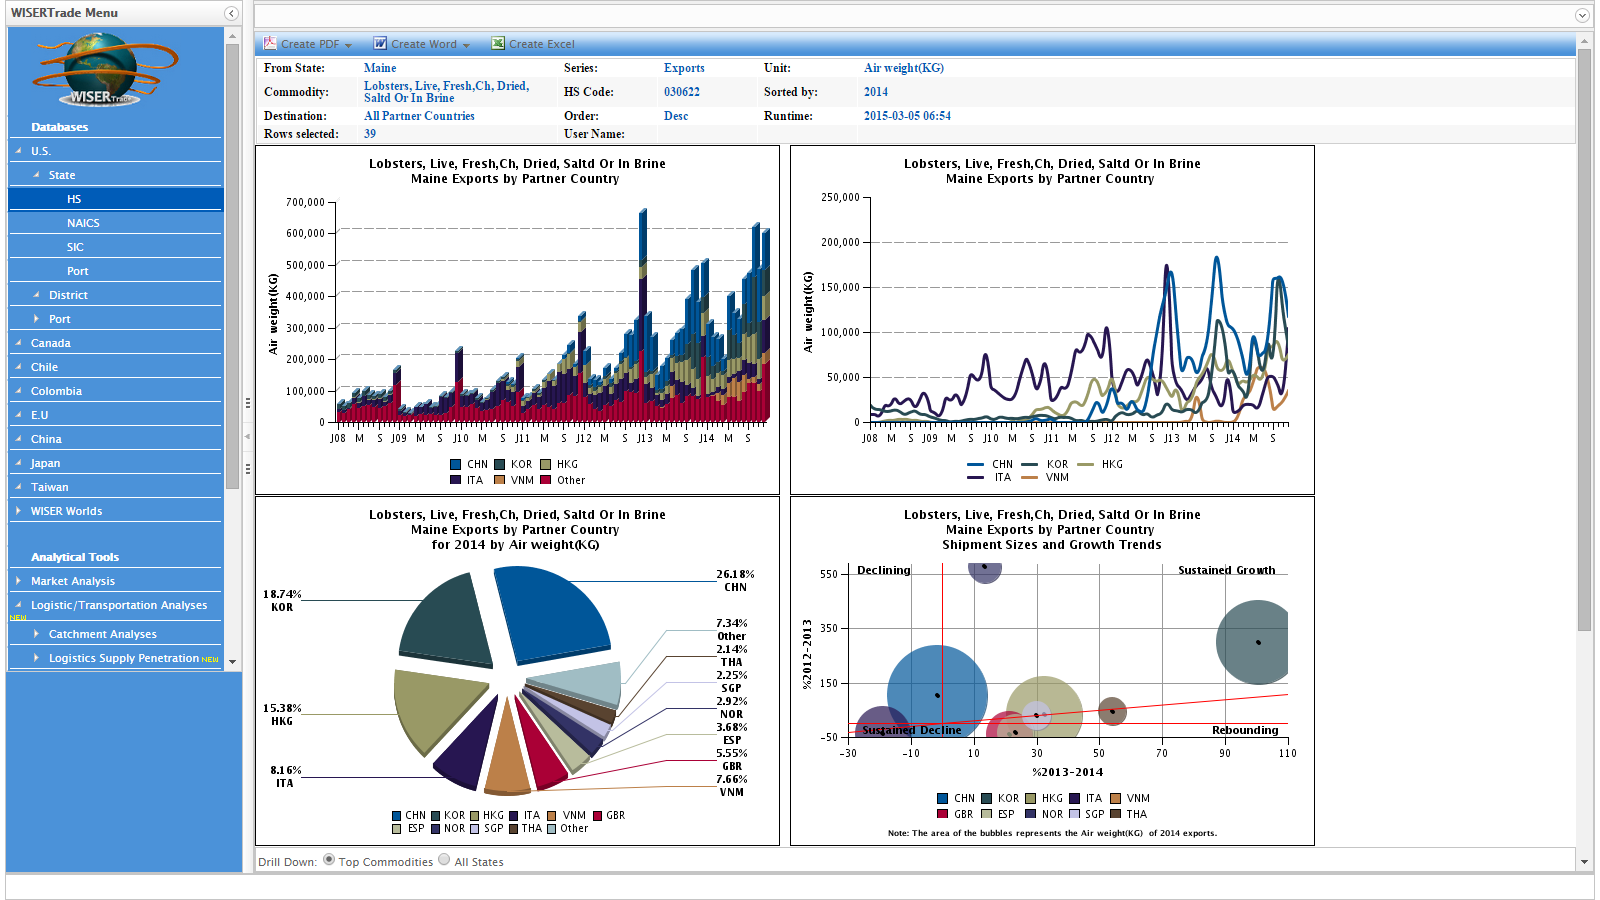
WISERTrade features data drilldowns, dashboard graphics, easily customizable lists of states, ports, provinces, commodities and partner countries, and outputs to pdf, MS Word and Excel. The data provide both macro and micro levels of detail, by 2-11 digit HS commodity codes, sub-national origins and destinations, ports and transportation mode by value and cargo weight for the U.S. and other countries, and long annual and monthly time series. The data can identify markets of opportunity for your product, monitor your competition, calculate your share of world markets, evaluate trade performance of your state, port, country or product. The data provides opportunity to research world trade flows. WISERTrade is the leader in turning data into knowledge.
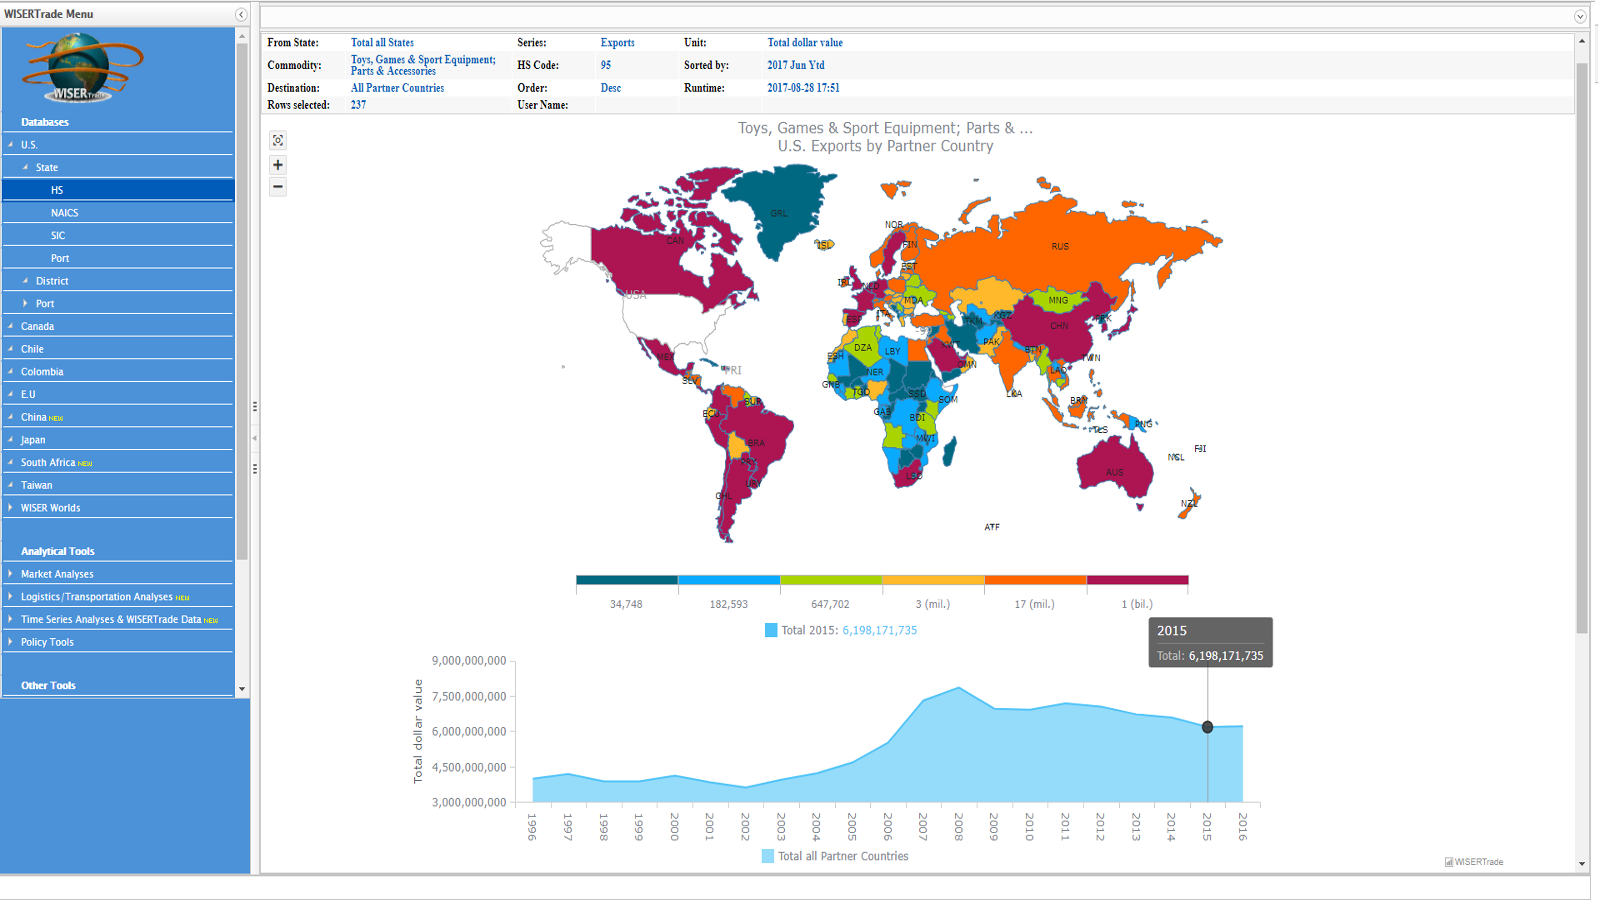
NEW! WISERTrade added mapping capability to its data and analytical tools. This applies to all geographies existing in WISERTrade. The maps can be printed, saved for use in reports, and adjusted in terms of color and map projection. The map and associated chart are interactive, allowing user to highlight specific ranges of activity.
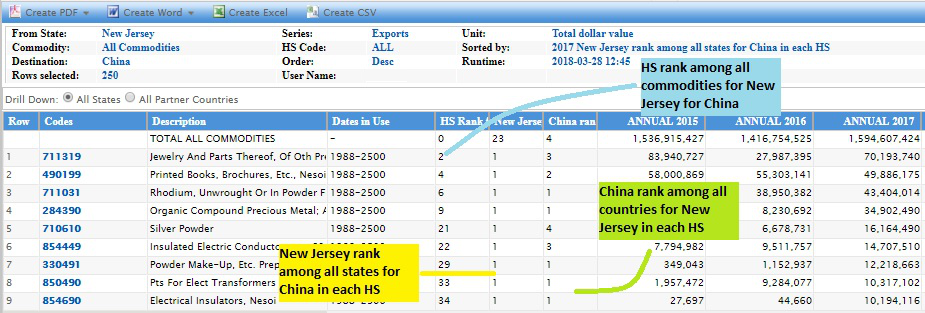
NEW! WISERTrade just added Strategic State/Port Rankings. The WISERTrade Ranking Option ranks U.S. State and Port trade data, and Canadian Province and Port trade data,
on Commodities exported or imported by up to three search variables, simultaneously, depending on the search.
The ranking results table shows state, port, or province rankings among the states, ports, or provinces relevant to the query.
It will simultaneously show the country ranking among all countries relevant to the query,
and the commodity ranking among all commodities relevant to the query.
Please register for a webinar to learn more!
Market Analysis
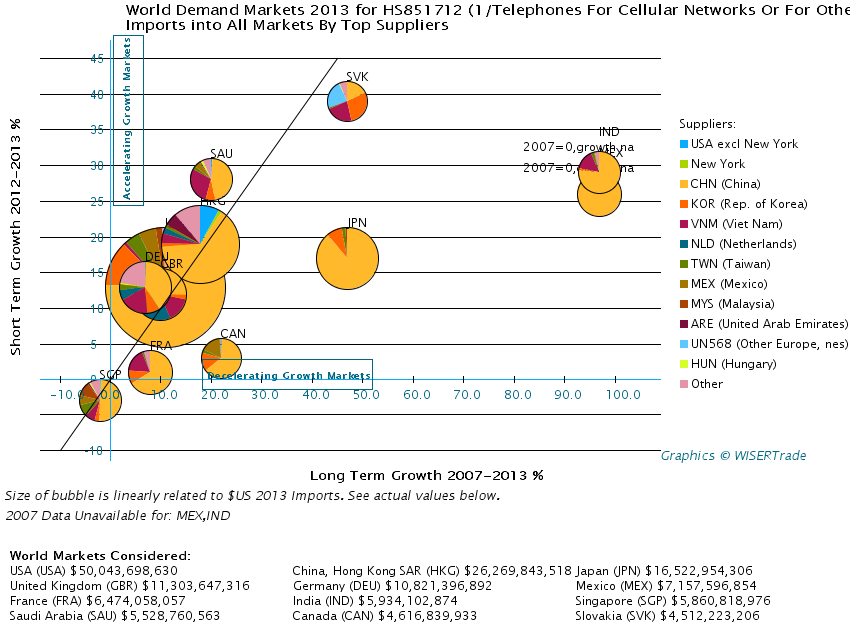
Market Penetration
shows, for the world or for a world region as chart bubbles, the total size of imports among the largest and most significantly growing country markets for commodities. The size of each bubble is proportional to the size of each market. Major suppliers and their penetration into import flows of key markets are shown on the right hand graph legend. Their penetration into these markets are presented as pie slices superimposed on the bubble faces. The user focuses on a single country, a sub-national part of the focus country (i.e. states, provinces, etc.), and other major suppliers to the listed buyers.
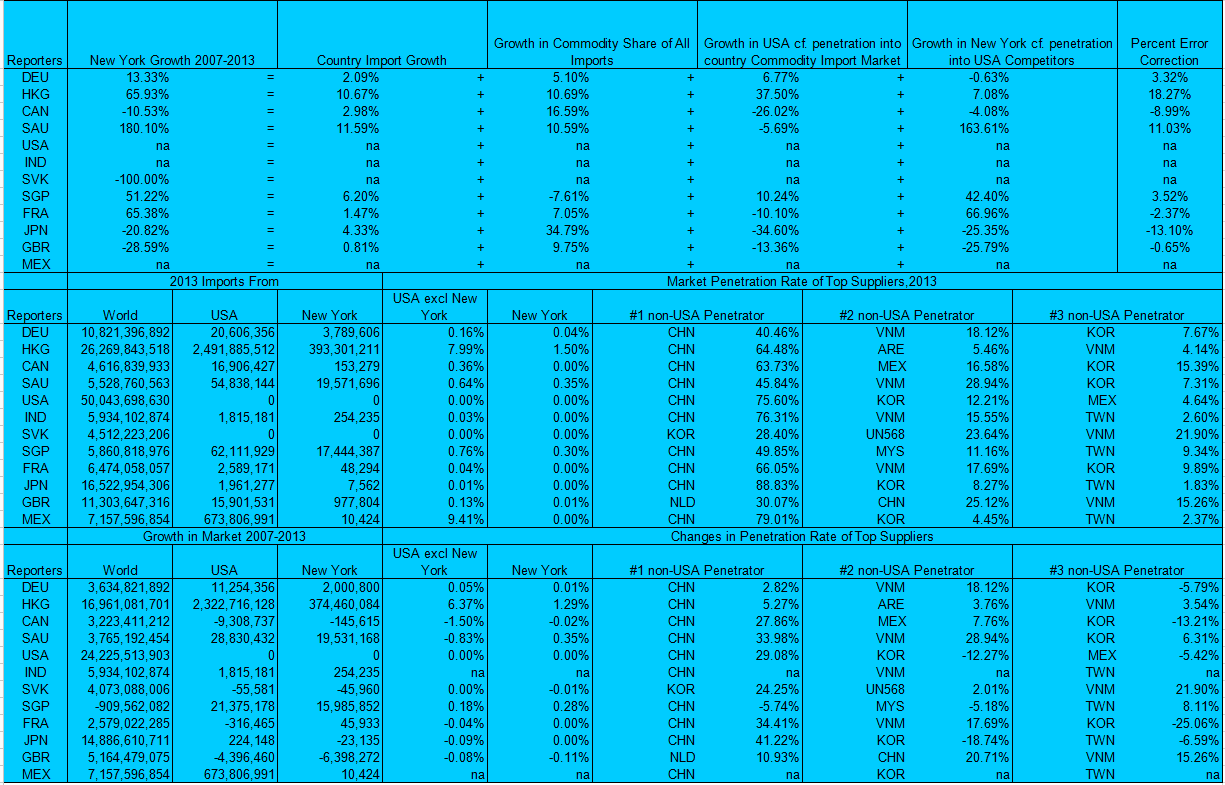
A simultaneously available output table "decomposes" growth of suppliers from a named region to top, identified destinations decomposing growth to each country into four parts:
a. overall levels of importing generally of the importing country,
b. the degree of concentration within the country on the product being investigated,
c. focus of importing country on imports from the main supplier being investigated, and
d. where there are sub-national regions, the degree of penetration of regional suppliers, among the subscribers.
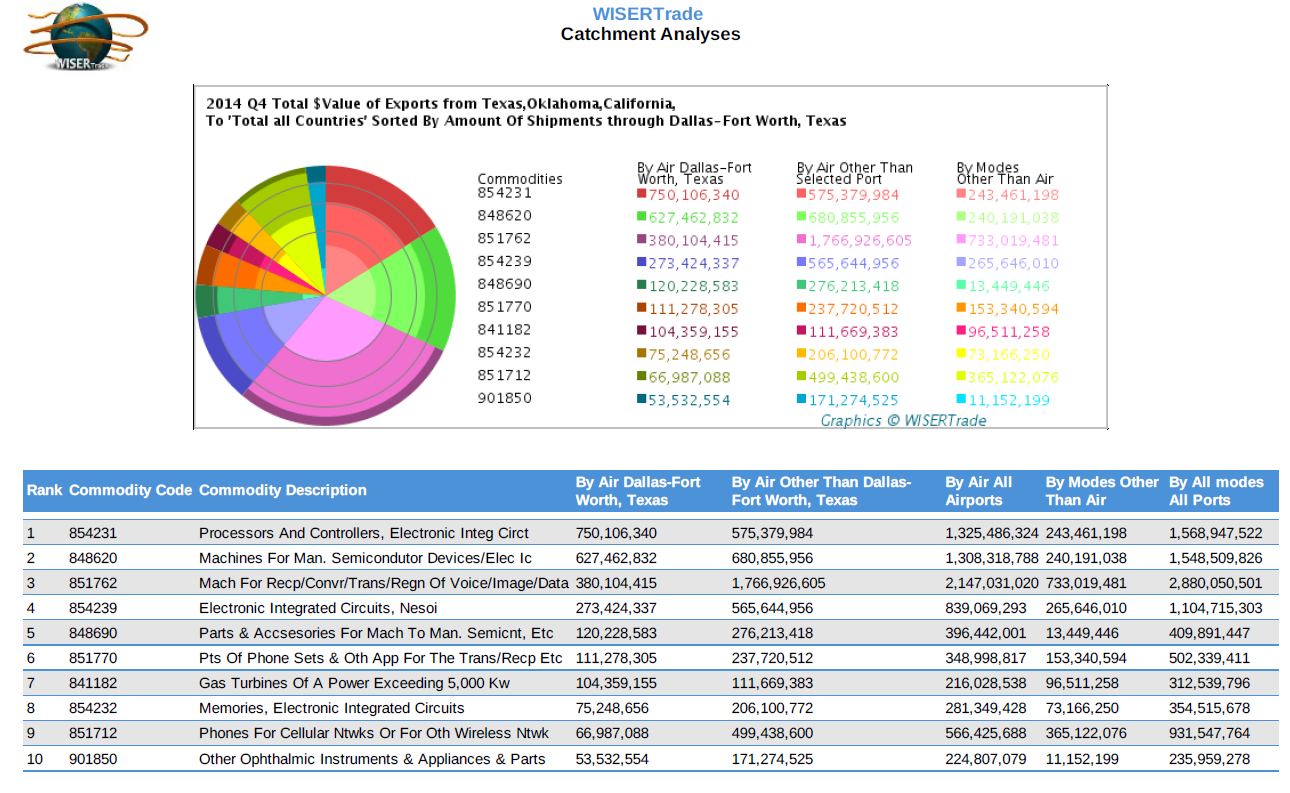
Logistics Supplier Catchment Analysis
shows for any port, the major commodities shipped to the world or to a user specified market, originating in the port's catchment area of leading states, provinces, etc., or originating in a user's specified region.
Commodity bundles can be shown at any level of detail, clustered around any subset, or exclude any commodity types that might otherwise obfuscate the catchment graphic. The graphic, itself, shows the air-, sea- or land-port's penetration into shipments from its catchment area, the penetration of other ports using the same mode of delivery, and amounts by other modes. Size of the slices shows the potential the commodity offers the port for total shipments-their own and competitors, and the legend shows the rank order of each commodity in importance to the choice port.
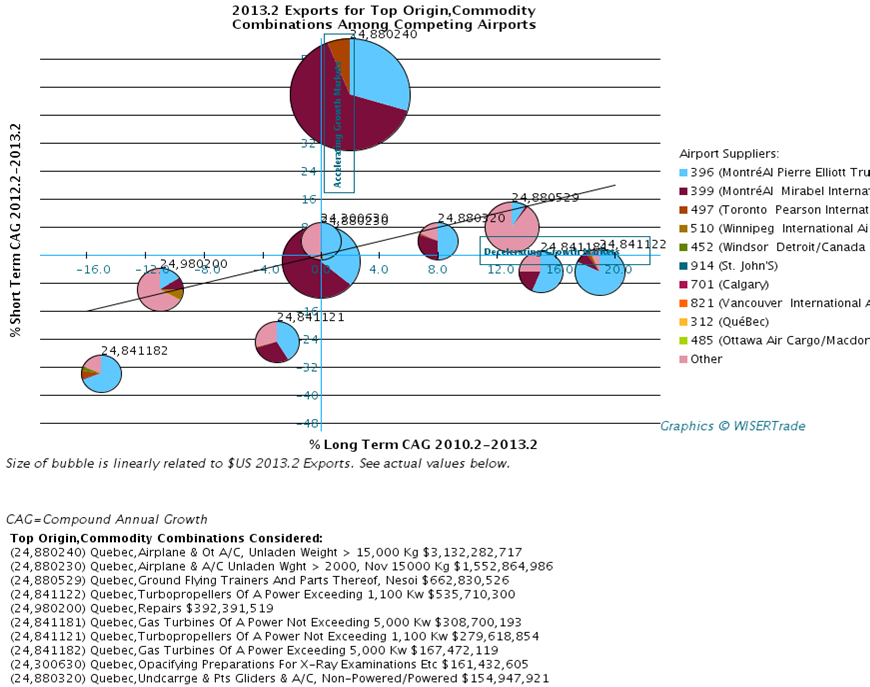
Logistics Supplier Penetration
shows the port export markets for catchment commodities (cc's which follow commodity flows from their origin in production to their destination in consumption), noting ports (specializing in air, water, and ground modes of transportation) through which the commodities flow along the way. This shows the importance of the cc's by using relative bubble sizes and port penetration as pie slices superimposed on the bubble faces. This may be seen for flows by mode, evaluating competitor port penetration in flows most important to user's chosen port including penetration across other modes.
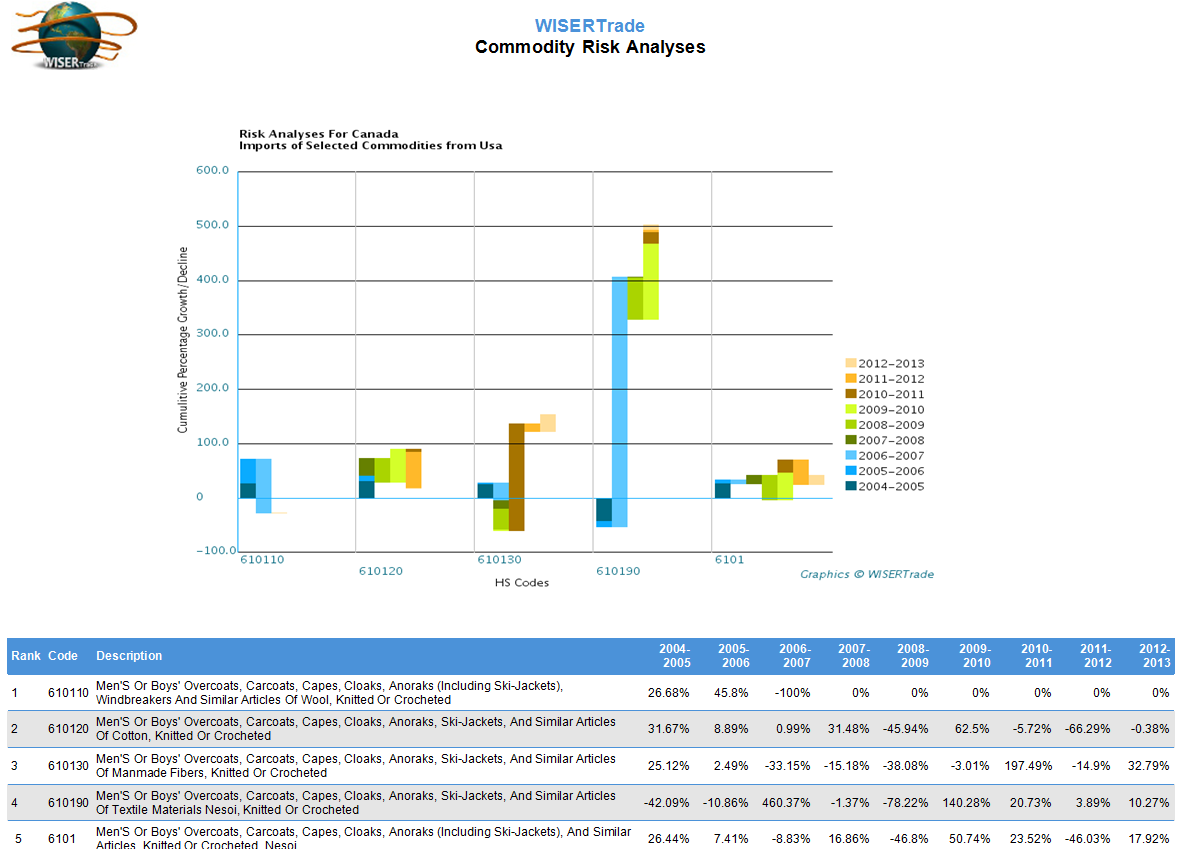
Commodity Country Risk/Return Analysis
depicts return as export growth (the height of the graphic) and risk as the variance among growth and decline periods for exports (the horizontal spread of the graphic).
Policy Analysis
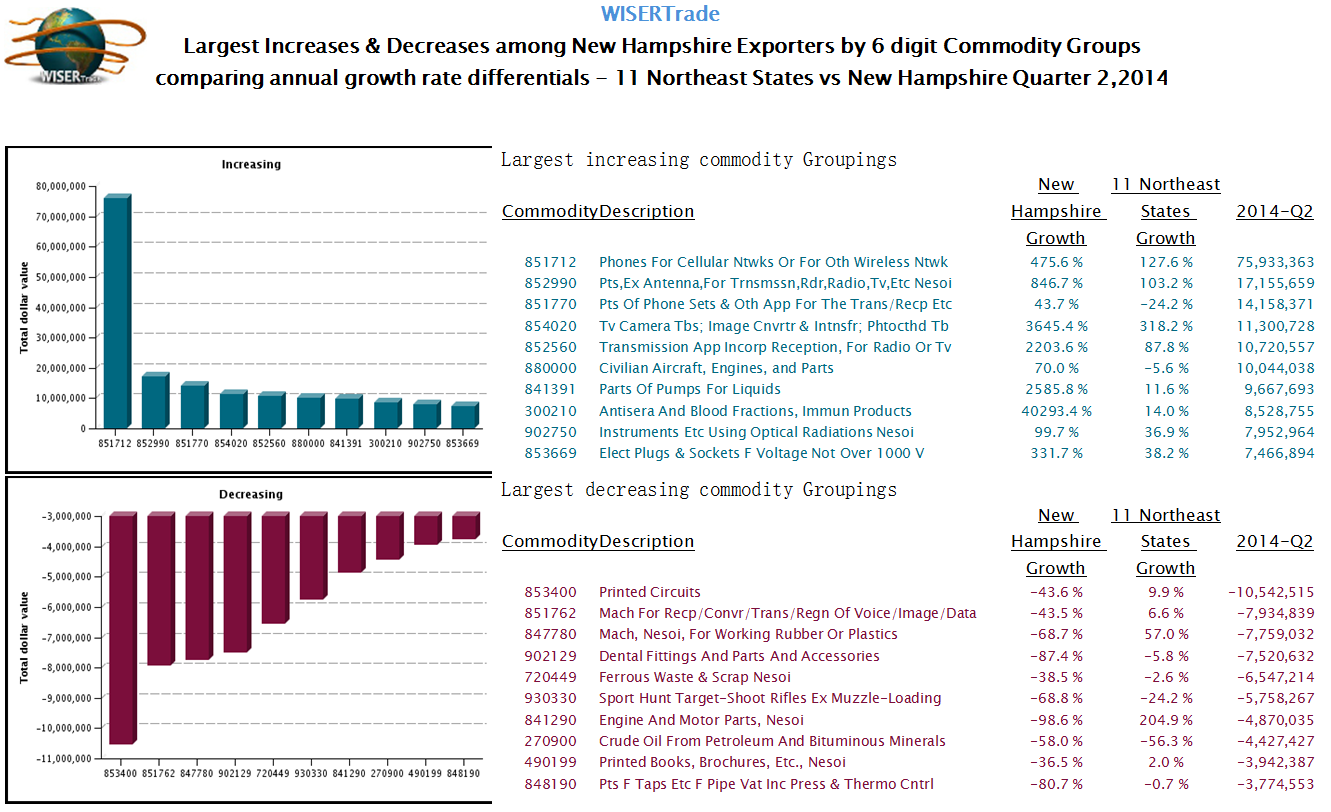
Winners and Losers Analysis
is an analytic that tells a firm in a region (or a larger country) whether it excels or lags in export growth of its commodities compared to a user chosen reference region (a larger region, a country or a continent) despite likely having wages, worker preparedness, taxes, exchange rates, and tariffs equal to well chosen reference regions. Better performance suggests better pricing, quality or marketing than reference regions.
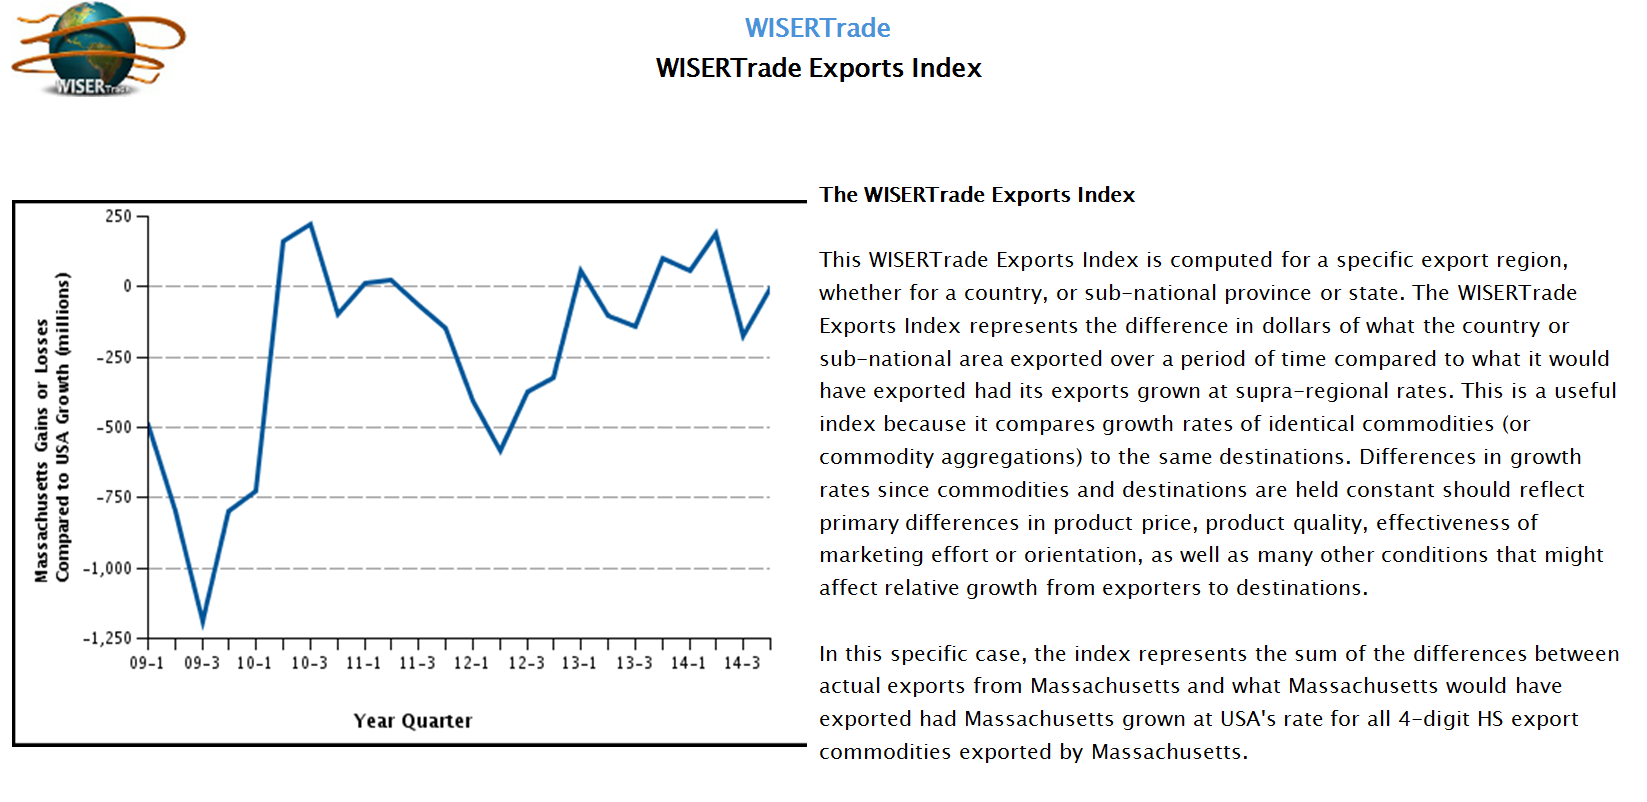
Quarterly Trade Index
for a Region or Country gives a leading indicator to a region about trade growing exogenously faster or slower, in total or for a commodity group, than its reference region. This is a likely cause of slowdown or quickening of a region's pace of growth. The analysis is much like the Winner and Loser Analysis except for including all commodities or commodity groups in its focus. The tool is very interesting to the press corps.
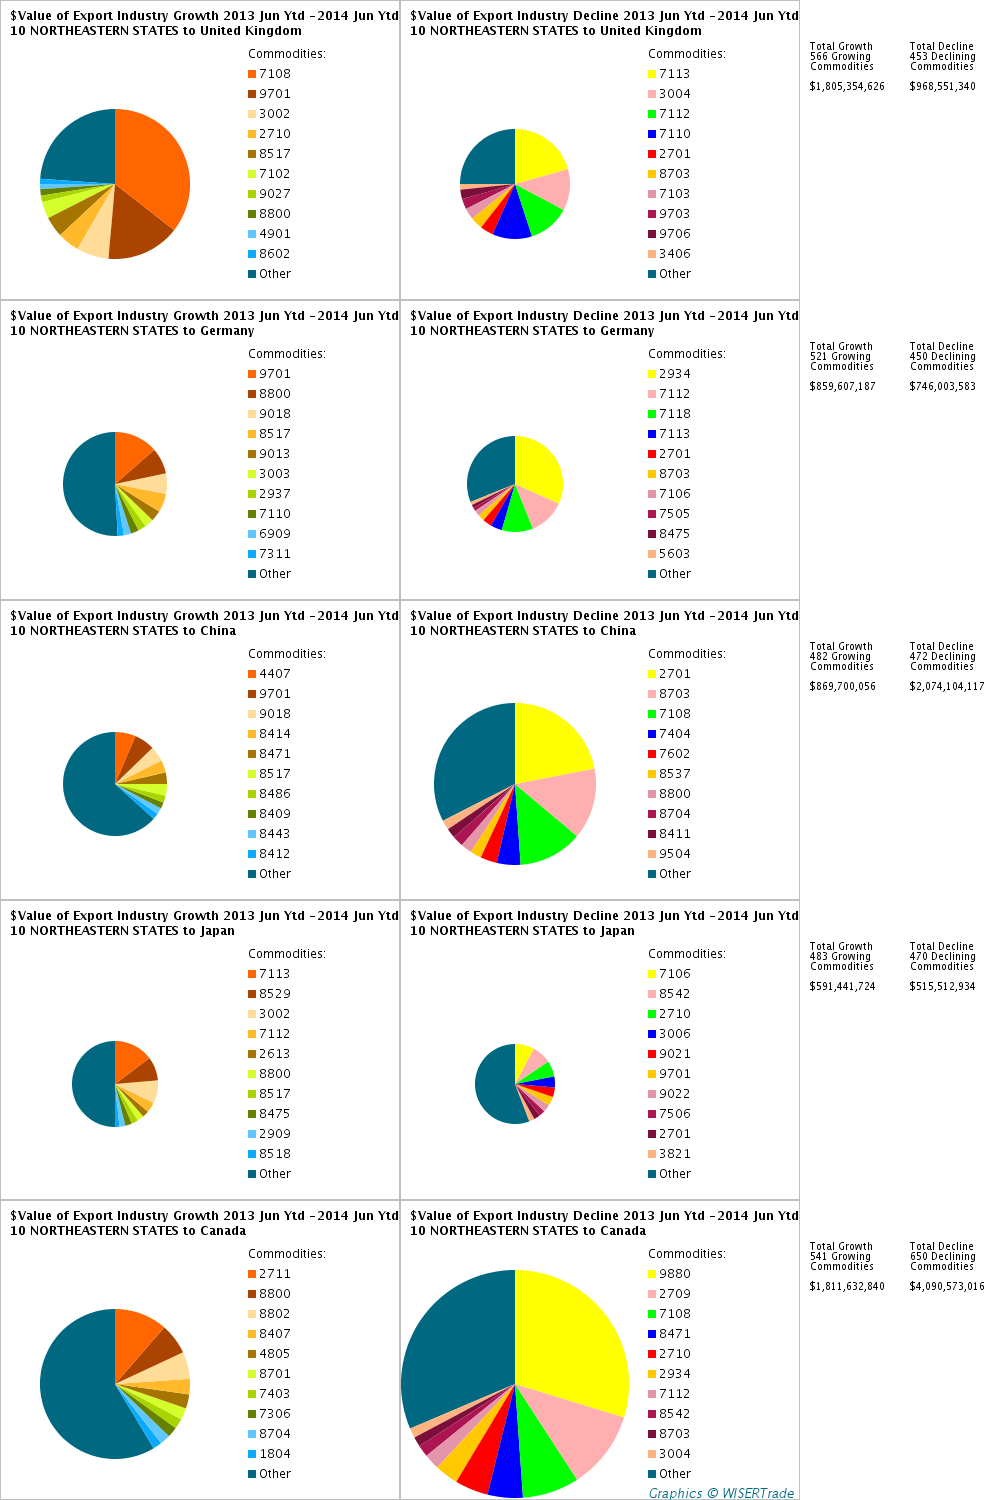
Growth Decomposition Analysis
is designed to focus on details with regard to bilateral blocks of countries. WISER has found that wherever growth (or decline) occurs, the growth or decline is not monolithic. Overall growth tends to mean significant growth in some commodities, but losses in others, and vice versa. The reverse is also true. With regard to any bilateral pair, policy makers in a country can find which industries are growing and which declining, and the overall balance-depending on relative sizes of the amounts of growth and decline. This analysis, like the Quarterly Trade Index, is likely to be very interesting to the press.